Building the Circularity Index System and Multi-Objective Optimization Model

RA3 represents the core analytical synthesis of the project. In this "Evaluating" phase, the empirical data from RA1 and the normative benchmarks from RA2 are integrated to construct a novel set of composite indexes for measuring circularity, along with a multi-objective optimization model to identify the most efficient pathways for CE transition. The H-SMA-CE project adopted a Composite Indicator (CI) framework following OECD (2008) standards. This approach mathematically aggregates 17 individual indicators into 6 domain scores, which combine into a single Municipal Circularity Economy Index (MCEI). This architecture provides a headline metric for benchmarking, domain-level scores for diagnostic analysis, and detailed indicators for targeted intervention planning.
Duration: Year 2 — First Semester
Status: Completed
Lead: RU2 — University of Naples "L'Orientale"
Selection of the set of methods and Composite Indicators applicable on a HST scale, based on the results of literature and context analyses.
Analysis and interpretation of data through the application of multivariate statistical tools.
Construction of optimal solution for increasing CE at HST level, through multi-objective optimisation techniques.
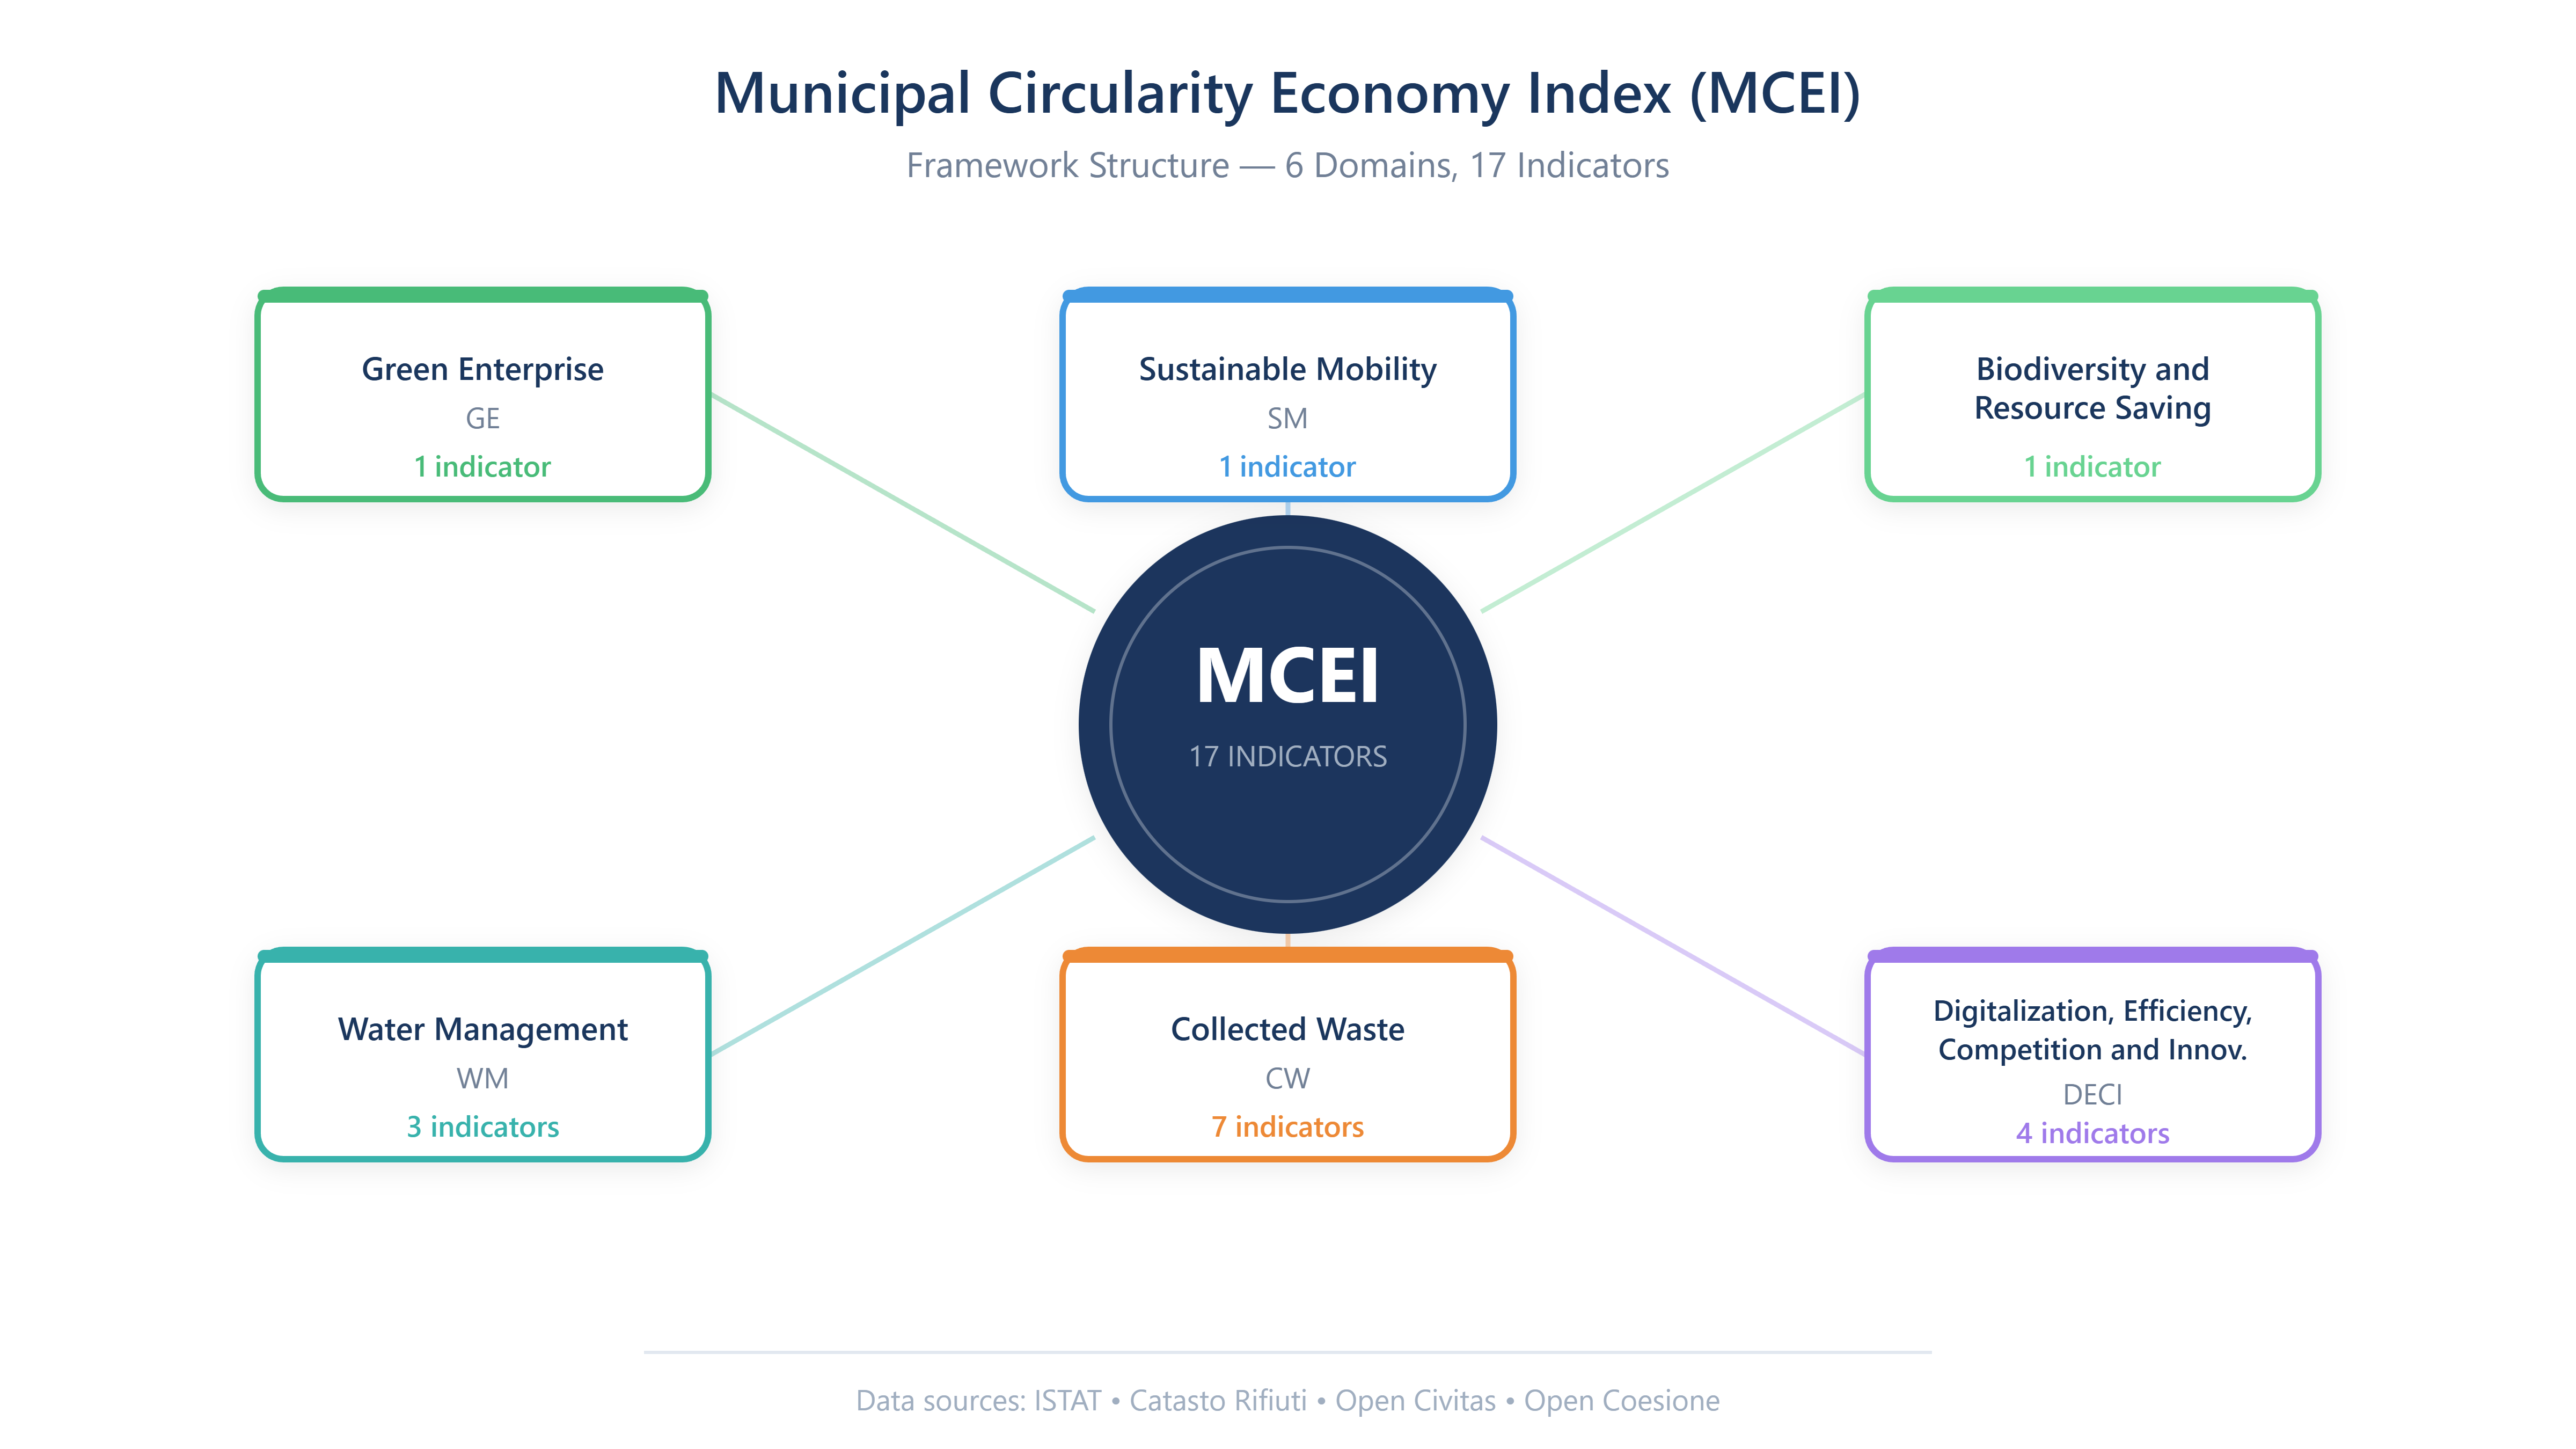
Building on the RA2 literature review, a composite circular economy index was developed specifically for HST assessment. The framework started from the Municipality Indicator of Circular Economy (MICE) by Ghinoi et al. (2024), which was expanded and integrated with additional domains from complementary studies. The final structure comprises six assessment domains: Green Enterprise, Sustainable Mobility, Biodiversity and Resource Saving, Water Management, Collected Waste, and DECI (Digitalization, Efficiency, Competition, and Innovation). Each domain aggregates specific indicators drawn from reliable Italian databases including ISTAT, Catasto Rifiuti, Open Civitas, and Open Coesione. A two-stage selection methodology was employed, combining "top-down" approaches from established international frameworks with "bottom-up" contextual filtering based on Taurasi's metabolic profile, resulting in a final set of 17 indicators that balance academic robustness with practical relevance for HST contexts.
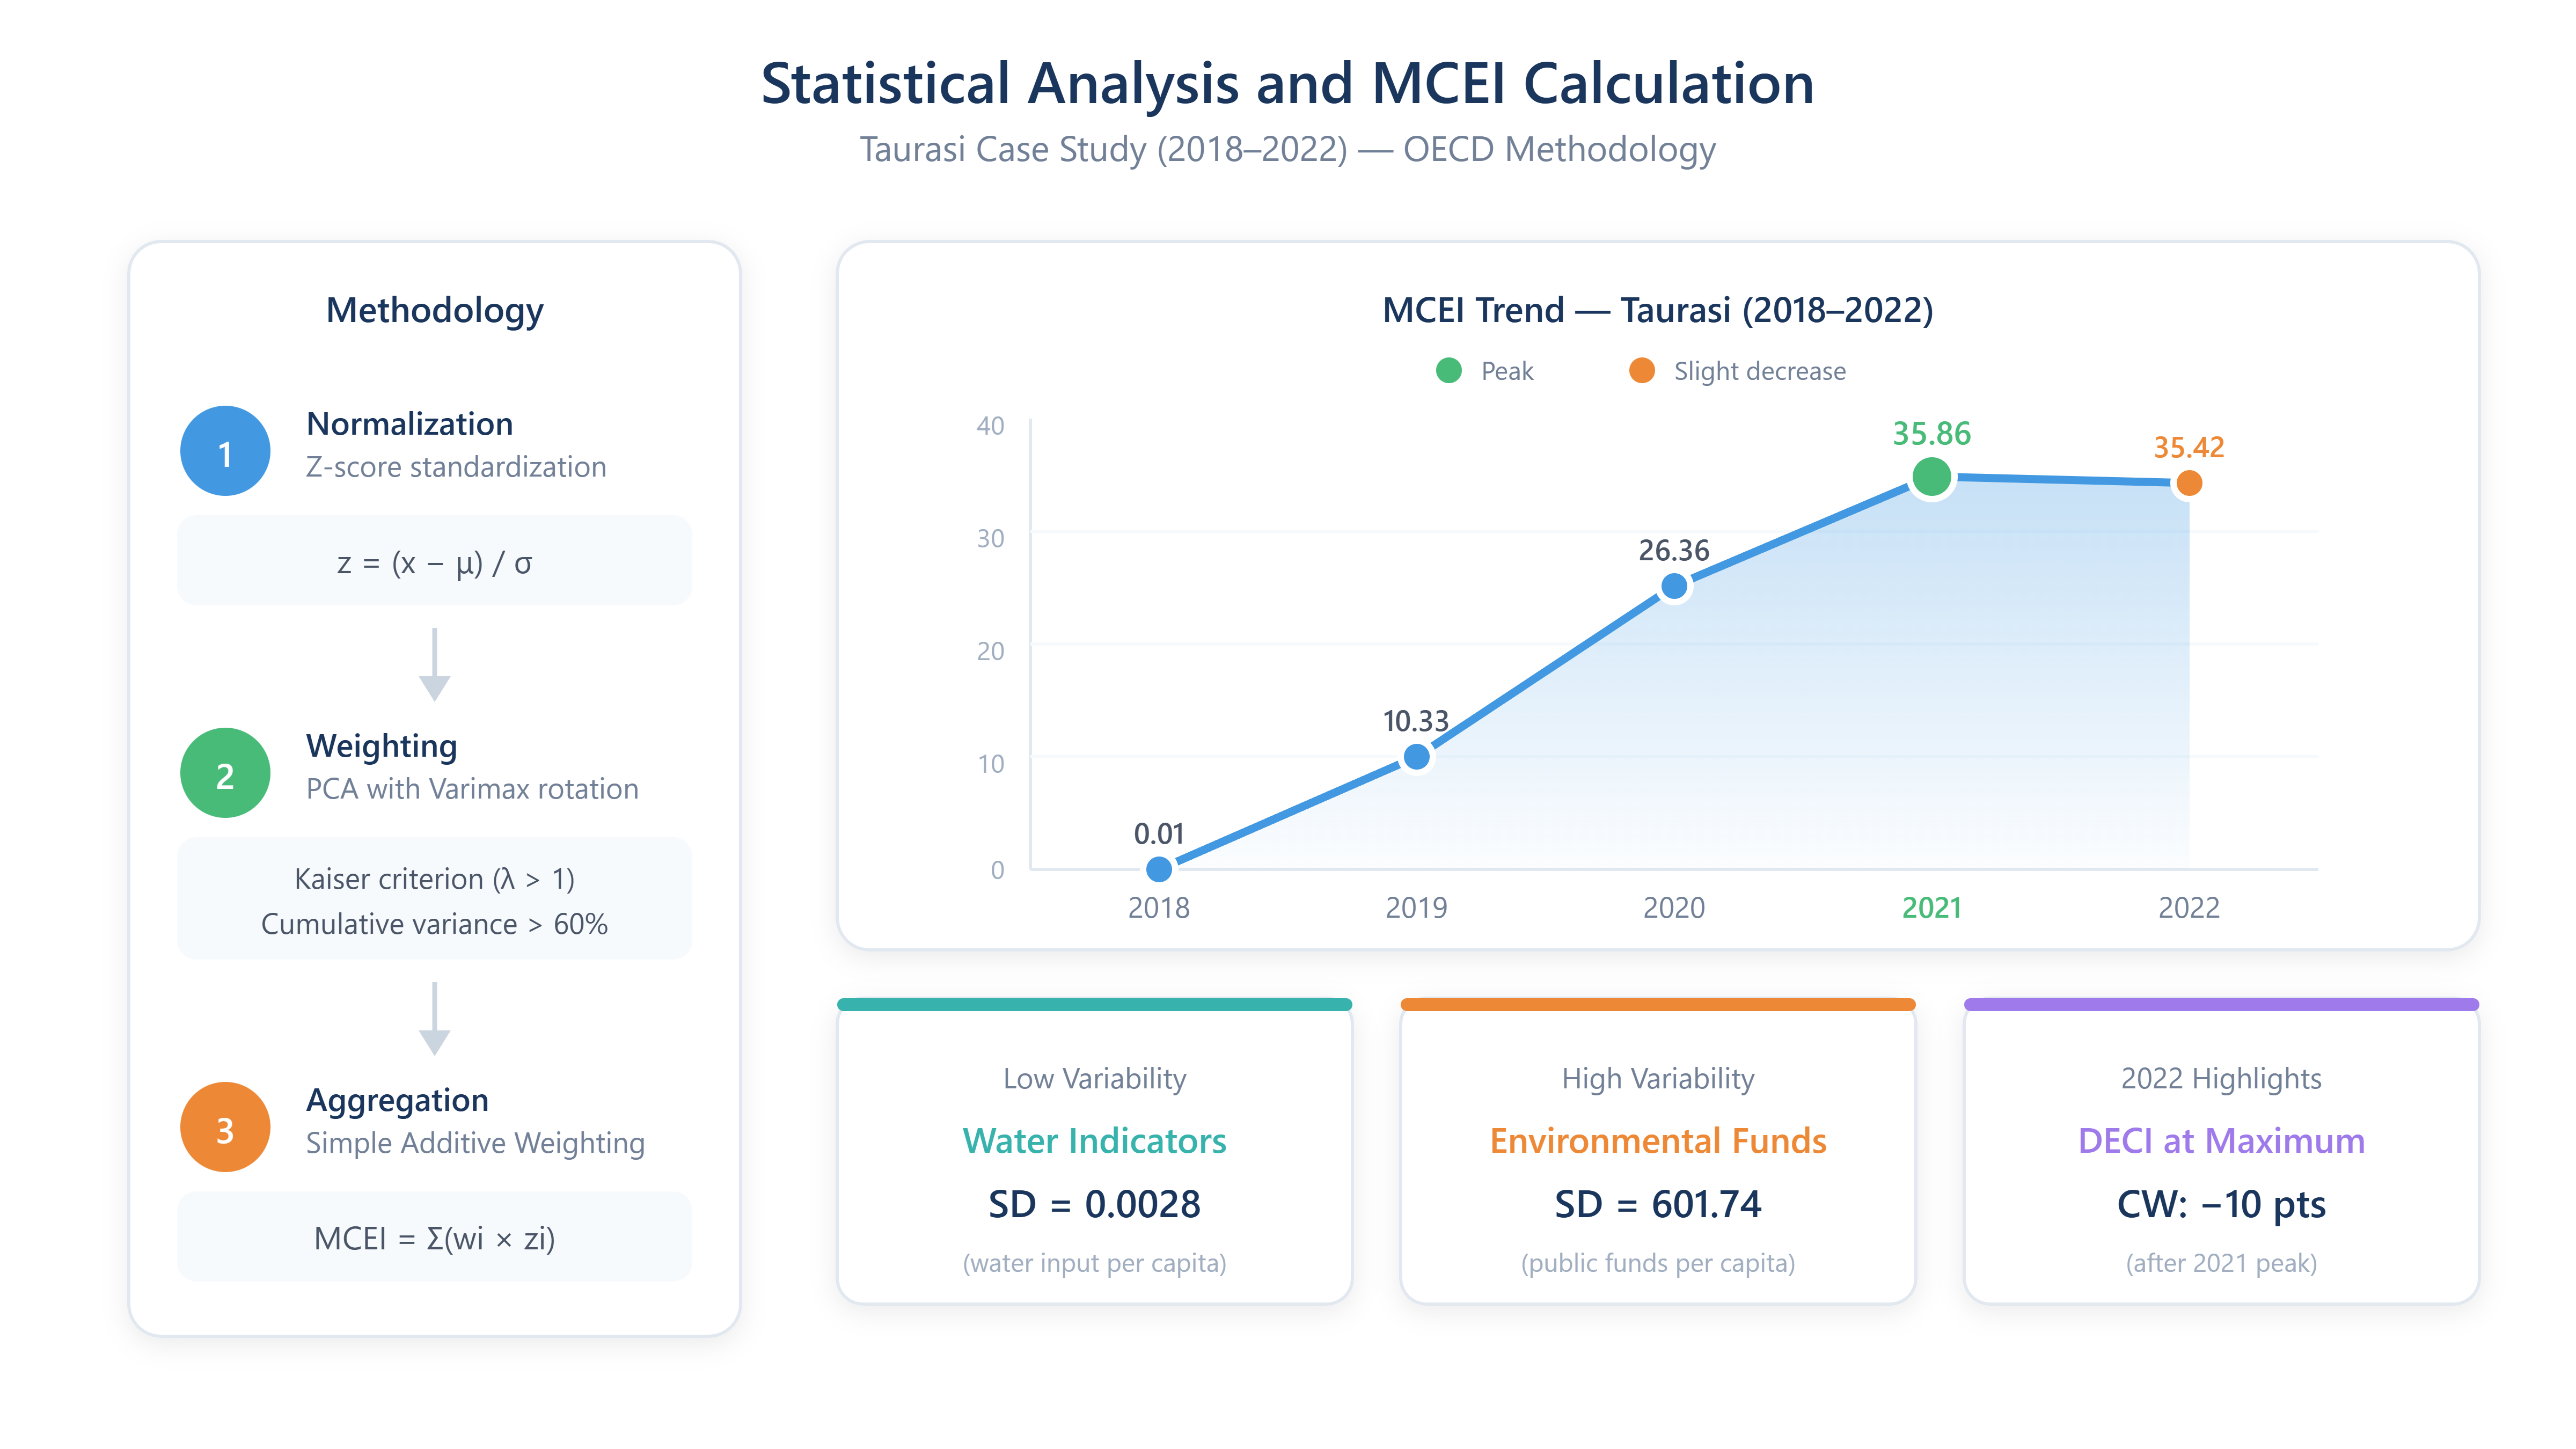
Following OECD (2008) methodology, three phases were implemented: normalization, weighting, and aggregation. Data were normalized using z-score standardization, calculated as the difference between each value and the average value divided by the standard deviation. Weight assignment was performed through Principal Component Analysis (PCA), using Kaiser's criterion to select eigenvalues greater than one, ensuring cumulative variance explanation exceeding 60%. Varimax rotation was applied to enhance factor interpretability. Weights were computed according to Arbolino et al. (2024) as the ratio of percentual variance explained by each factor over cumulative explained variance, multiplied by component scores. The composite index was constructed using Simple Additive Weighting (SAW). Descriptive statistics for Taurasi (2018-2022, N=5) revealed heterogeneous variability across indicators: water-related indicators showed minimal variation (e.g., water input per capita SD=0.0028), while public funds for environmental projects exhibited substantial variability (SD=601.74). The MCEI showed consistent improvement from 2018 to 2021, with slight decrease in 2022. Domain analysis revealed "Water management" and "DECI" reaching maximum values in 2022, while "Collected waste" experienced a 10-point decrease after peaking in 2021.
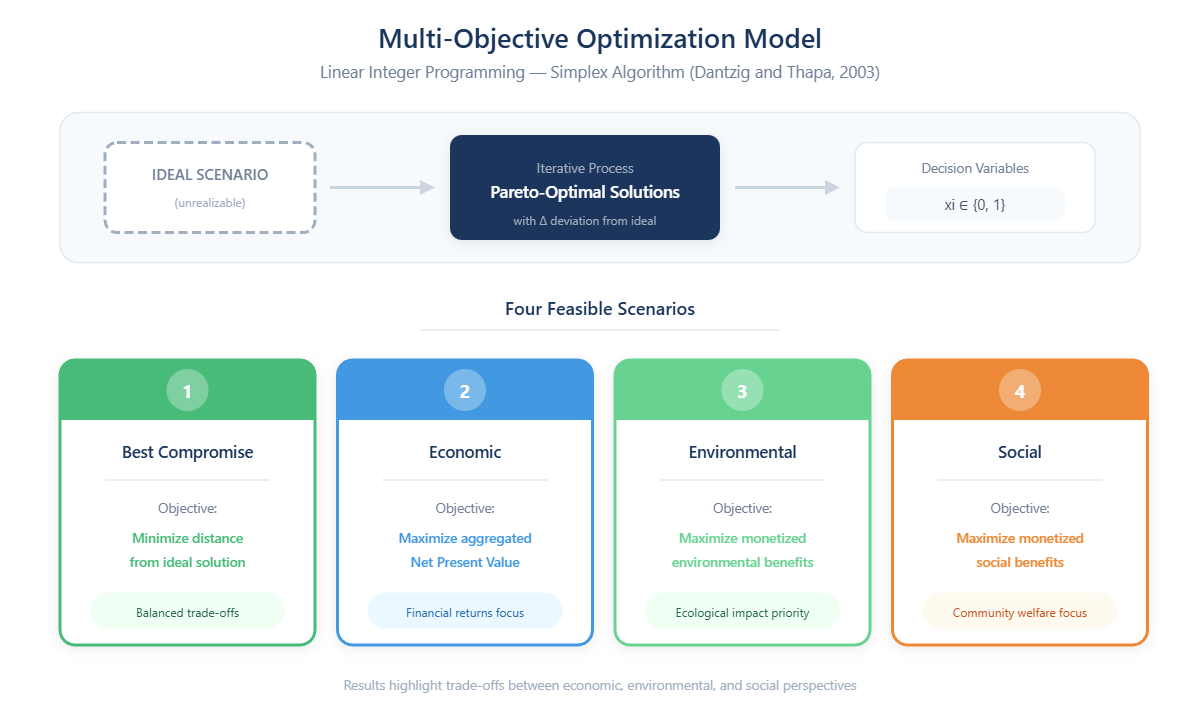
A linear integer programming model, solvable using the simplex algorithm (Dantzig and Thapa, 2003), was developed for optimal intervention selection. Decision variables are represented by CE interventions analyzed in previous activities, each assuming binary values (0=absent, 1=present in action plan). The model generates four scenarios compared to an unrealizable "ideal scenario" where all objectives achieve optimal values simultaneously. The four feasible scenarios are: "Best Compromise" (minimizing distance from ideal solution), "Economic" (maximizing aggregated Net Present Value), "Environmental" (maximizing environmental benefits), and "Social" (maximizing social benefits). This iterative approach strengthens the interactive dimension of decision-making: the decision-maker defines targets, the analyst applies the model to assess alternative impacts, and final choices reflect both priorities and model results. Each iteration yields either a Pareto-optimal solution or enables further refinement through additional constraints. Results are presented with deviation (Δ) from ideal vectors, highlighting necessary trade-offs when optimizing from economic, environmental, and social perspectives simultaneously.